
Glaciers Svalbard (NPI)
Product summary
The main product provided by Sub-service Glaciers Svalbard is the inventory of glacier area outlines (GAO) at Svalbard. Glacier outlines have been created for the years 1936, 1966-71, 2001-2010 and 2020. The historical digital GAOs from 1936 and 1966-71 were based on aerial photography and does not cover all glacier areas. The first complete digital glacier inventory (2001-2010) was based on various satellite imagery (ASTER, SPOT and Landsat) (König et.al. 2013). The inventory of 2020 was obtained using Sentinel-2 imagery (10 m resolution) as a part of the project Copernicus Glacier Service (Andreassen et al. 2021, Lith et al. 2021).
Background
The archipelago of Svalbard contains approximately 32,000 km2 (Lith et.al. 2021) of glaciers, with a large number of small valley glaciers as well as large areas of contiguous ice fields and ice caps. Digital glacier outlines have been created for the years 1936, 1966-71, 1990, 2001-2010 and 2020. A complete coverage of Svalbard is available for the 2001-2010 and 2020 dataset.
Historical glacier outlines were created using cartographic data from the original Norwegian Polar Institute topographic map series of Svalbard as basis by delineating individual glaciers and icefields, assigning unique identification codes relating to the hydrological watersheds, digitising centre lines, and providing a number of attributes for each glacier mask. The 2001-2010 glacier outlines are derived from orthorectified satellite images acquired from the SPOT-5, ASTER and Landsat satellite sensors. In areas where coverage for all time periods is available, the overwhelming majority of glaciers are observed to be in sustained retreat over the period from 1936-2010.
A new digital glacier inventory has been made based on Sentinel-2 imagery from summer 2020. The inventory is consistent with the 2001-2010 GAO by König et al. (2013). Calving front locations of tidewater glaciers have been further mapped on an annual basis since 2012 using Sentinel-2 and Landsat imagery, primarily from the period 15 August – 15 September each year. Frontal retreat dominates in all regions, but a smaller number of glaciers have advanced due to temporary glacier surges.
Retrieval algorithm
The historical digital GAOs from 1936 and 1966-71 and the digital glacier inventory from 2001-2010 were manually digitised based on aerial photography and various orthorectified satellite imagery (ASTER, SPOT and Landsat), respectively.
To estimate GAO for the new inventory (2020), a band-ratio thresholding method was applied to the orthorectified Sentinel-2 data to produce automatically generated glacier masks/outlines adapted to the Svalbard region. The raster masks were made tile by tile (100 × 100 km areas) and mosaiced for each satellite overpass to make continuous along-track glacier masks in full 270 km swath-width before converting to glacier outlines. The best outlines for each glacier region were used as a starting point for manual checking, editing and validation based on the source imagery, higher resolution orthophotos, previous glacier inventories and maps/DTMs (Andreassen et al. 2021).
Before manual editing, the automated outlines were split into separate vector layers for the outer perimeter (large polygons), the nunataks (small polygons) and the drainage divides (lines inherited from the previous inventory). These layers were edited separately based on the best available Sentinel-2 imagery from summer 2020. In some areas, the automated outlines could be used directly, whereas in shady areas and for debris-covered glaciers, they were not able to detect the whole glacier area. To better separate areas containing ice and not, land surface temperatures (LST) derived from the Thermal Infrared Sensor of Landsat 8 was used to visually edit or replace erroneous outlines from a band-ratio method.
Annual calving front positions were manually digitised from end-of-summer Sentinel-2 imagery and are available as an additional product through the Copernicus Glacier Service.
Validation
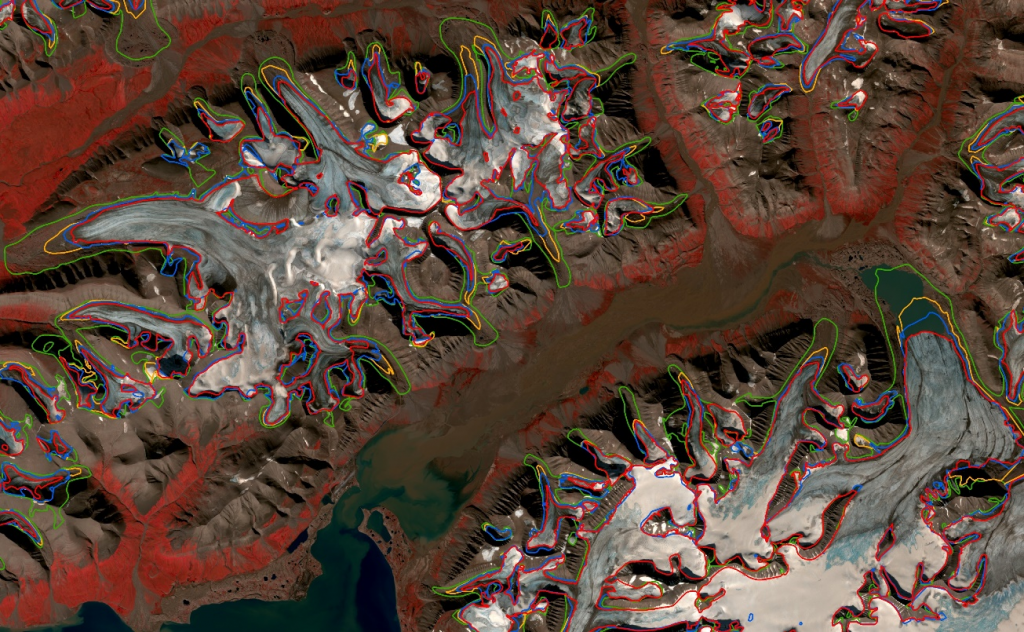
The new 2020 glacier inventory is manually quality-controlled and validated against other Sentinel-2 imagery, Landsat 8 land surface temperatures, and other auxiliary data, such as orthophotos and DTMs. It has not yet been carefully analysed for glacier changes with respect to earlier inventories, but a substantial glacier retreat over the last 10-20 years is obvious (see figure) especially along the western and southern coast of Spitsbergen. The only near-stable glacier areas are found on Nordaustlandet and at the north-eastern tip of Spitsbergen.
In total for Svalbard, the new glacier inventory indicates a current glacierized area of 32,000 km2 whereas the previous digital inventory from the 2000s had a total of 33,800 km2. The analogue inventory of Hagen et al. (1993) had a total of 36,600 km2. Robust statistical comparisons of inventories are difficult due to different data sources, mapping methods and personal interpretations, but if we take the numbers as they are, Svalbard has lost ~5% of its glacier area during the last ~15 years.
References:
Andreassen, L.M. (ed.), G. Moholdt, A. Kääb, A. Messerli, T. Nagy and S.H. Winsvold, 2021. Monitoring glaciers in mainland Norway and Svalbard using Sentinel. NVE Rapport 3-2021, 94 s. https://publikasjoner.nve.no/rapport/2021/rapport2021_03.pdf
Hagen, J. O., O. Liestøl, E. Roland and T. Jørgensen, 1993. Glacier atlas of Svalbard and Jan Mayen, vol. 129. Norwegian Polar Institute, Oslo
König, M., J. Kohler and C. Nuth. 2013. Glacier Area Outlines – Svalbard [Data set]. Norwegian Polar Institute. doi.org/10.21334/npolar.2013.89f430f8
Lith, A., G. Moholdt and J. Kohler, 2021. Svalbard glacier inventory based on Sentinel-2 imagery from summer 2020 [Data set]. Norwegian Polar Institute. https://data.npolar.no/dataset/1b8631bf-7710-449a-a56f-0da1a4fef608
Nuth, C., J. Kohler, M. König, A. von Deschwanden, J. O. Hagen, A. Kääb, G. Moholdt and R. Pettersson, 2013. Decadal changes from a multi-temporal glacier inventory of Svalbard. Cryosphere, 7, 1603–1621. https://doi.org/10.5194/tc-7-1603-2013.
Digital Object Identifier (DOI):
|
Institution/sub-service |
Variable/dataset |
DOI |
Remarks |
|
NPI Svalbard |
Glacier Area Outline (GAO) |
||
|
NPI Svalbard |
Glacier Area Change (GAC) |